Fig. 6.
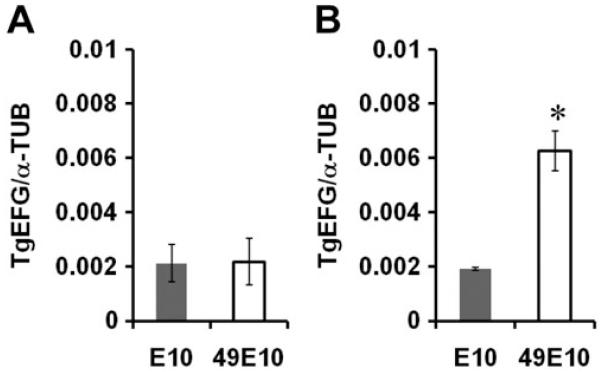
TgEFG mRNA levels in 49E10 are only altered in vivo
A. Quantitative RT-PCR was performed on RNA from in vitro grown E10 and 49E10 parasites using primers against TgEFG and α-tubulin. Standard curves were generated using the same primers to determine the copy number of TgEFG and α-tubulin in each sample and the ratio of the TgEFG copy number to α-tubulin copy number was determined. The average of three independent experiments is shown.
B. Quantitative RT-PCR was performed on RNA from in vivo derived E10 and 49E10 parasites as in A. (* p=0.0042).

