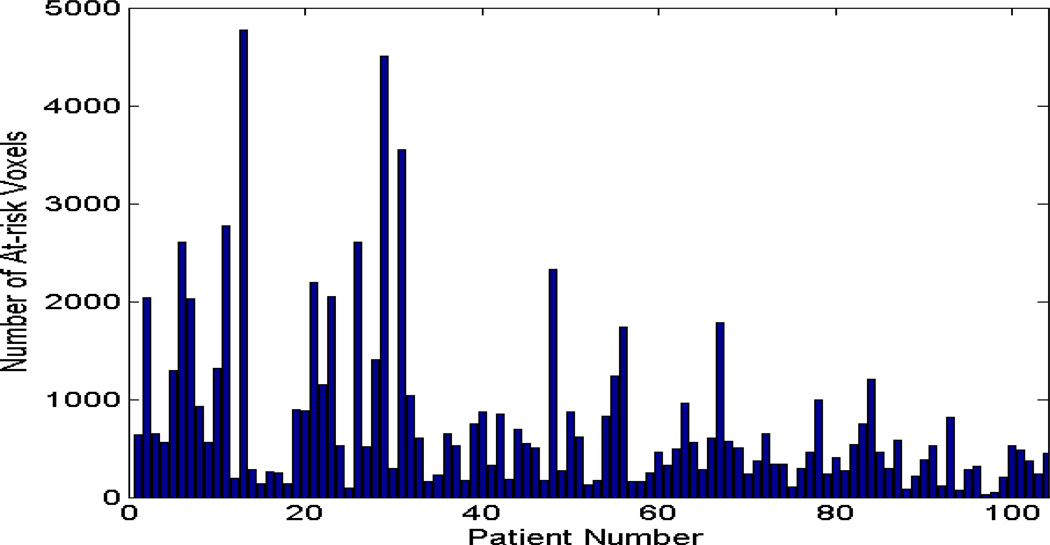
Figure 1. Distribution of at-risk tumor voxels.
The distribution of the total number of at-risk tumor voxels of the 102 tumors, which were classified by an example using a specific SI threshold = 2.1, from a DCE MRI study obtained at 2–2.5 weeks into treatment. There were 21 distributions generated by varying the SI values from 1.0 to 3.0 with an increment of 0.1 for ROC analyses.

