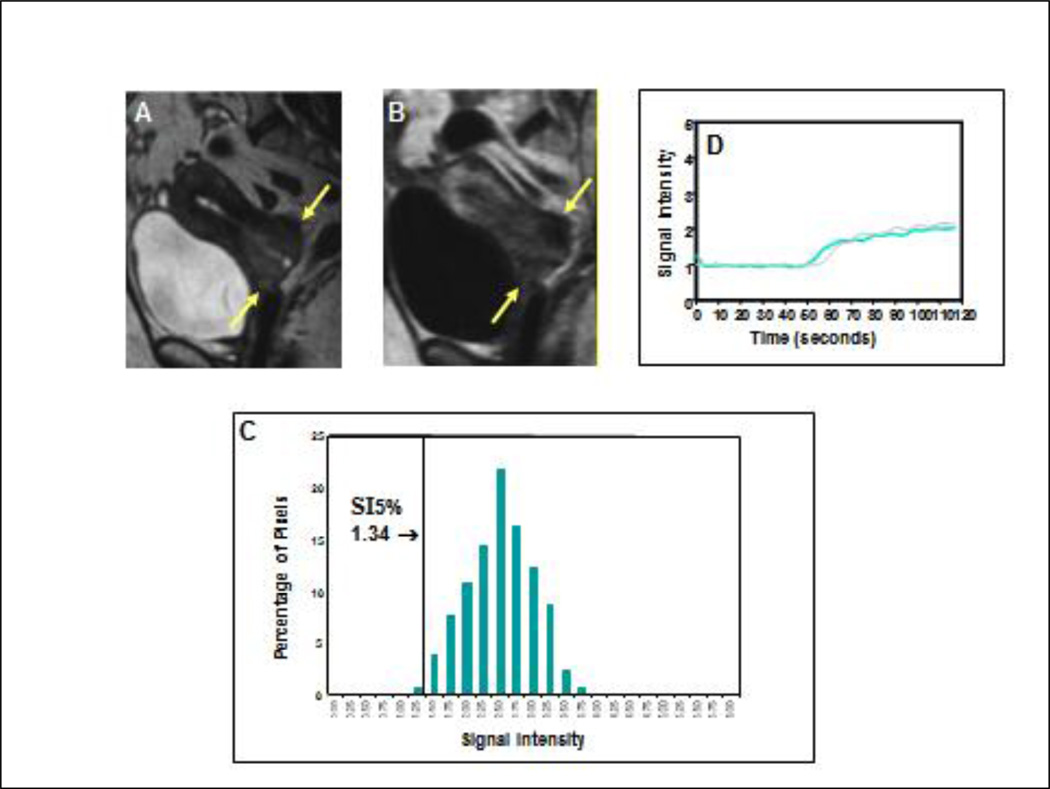
Figure 3. Poor clinical outcome with low perfusion status early during treatment for a small tumor.
Precontrast sagittal T2-weighted image (A) showed a much smaller cervical cancer (arrows), as compared with Figure 1, indicating a more favorable prognosis as judged by FIGO criteria. Corresponding DCE MRI at the plateau phase of the DCE imaging (B) showed the small tumor (arrows) with poor contrast enhancement indicating low tumor perfusion during early part (2 weeks) of the treatment course (8 weeks). From the tumor SI-pixel histogram (C), the low-DCE subpopulation was characterized by 5th percentile of SI (SI5%). SI5% was much lower (1.34) than that of Figure 1 (2.41). This patient had a primary tumor recurrence at 2 months after completion of therapy, and died 6 months after completion of therapy. Signal intensity-time DCE curves (D) again show sluggish and low contrast enhancement of the tumor mass indicating low tumor perfusion and poor response to treatment. In contrast to Figure 1, tumor perfusion remains low even 2 to 3 weeks after initiation of therapy (blue-colored curve) and is similar to that of the pretreatment (gray-colored curve).

