


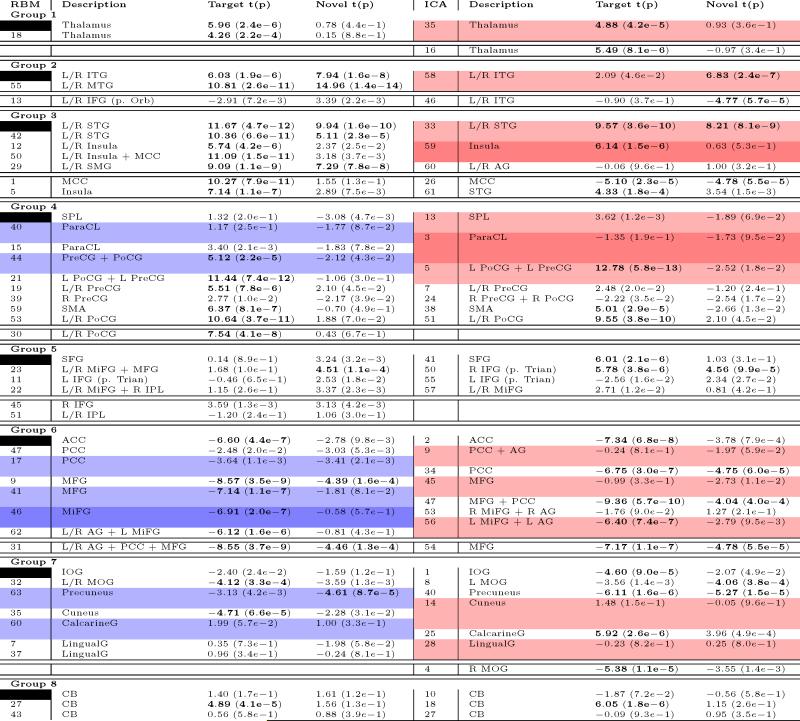
Table C.4.
Table C.5: * Feature number, primary regions, t-values, and p-values to target and novel TC for RBM (left) and matched ICA (right) from a second-level t-test. Groupings of components (1-8) are determined from RBM modularity and are generally not consistent with ICA FNC modularity. For each group, white-shaded features above the double-line indicate a one-to-one match between RBM and ICA features with spatial correlation above 0:4. RBM features highlighted in blue correspond to multiple ICA features with spatial correlation above threshold. Similarly, ICA features highlighted in red correspond to multiple RBM features above threshold. Below the double-line in each group are RBM and ICA features with no corresponding feature.
 |