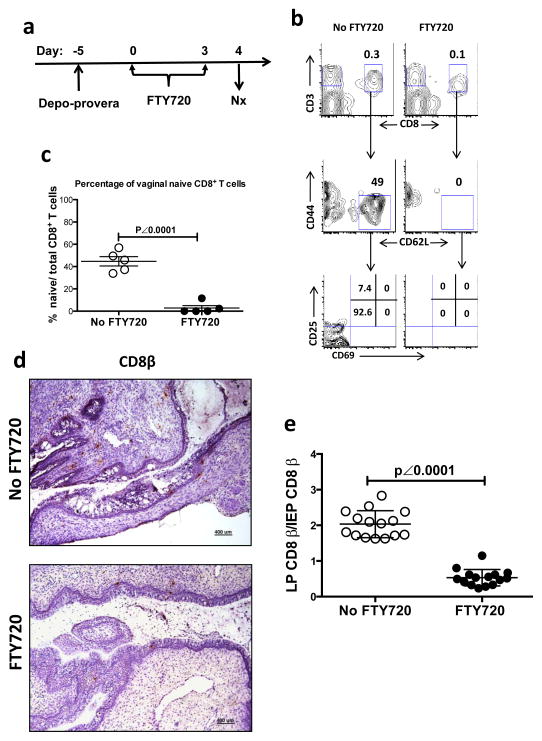
Figure 2. The phenotype and distribution of CD8+ T cells in vaginal mucosa of WT mice with or without FTY720 treatment.
(a to c) The naïve CD8+ T cells in the vaginal mucosa of WT mice with depo-provera synchronized estrous cycle. This is representative of 3 independently repeated experiments (n=5) with the same results. (a) Experimental design. (b) The gating strategy to identify vaginal naïve CD8+ T cells. (c) The percentage (mean ± SEM) of naïve CD8+ T cells in vaginal mucosa with or without FTY720 treatment. (d to e) Representative results of vaginal IHC staining showing the distribution of C8β+ cells in vaginal lamina propria and epithelium. (d) Representative IHC photomicrographs showing the CD8 β+ cell in both vaginal epithelium and lamina propria of the mice treated either with or without FTY720 (Scale bar: 400 μm). (e) The ratio of LP C8β+ cells/IEP C8β+ cells summarized from the pool of 3 independently repeated experiments (n=15). The numbers of LP and IEP C8β+ cells were counted from 3 vaginal tissue sections from each animal. To avoid counting the same cell multiple times on adjacent tissue sections, we selected the slides with the vaginal tissue sections that were cut 25 μm apart based the diameter of T cells (5–20 μm)63. The p value was generated using a Student’s t test.

