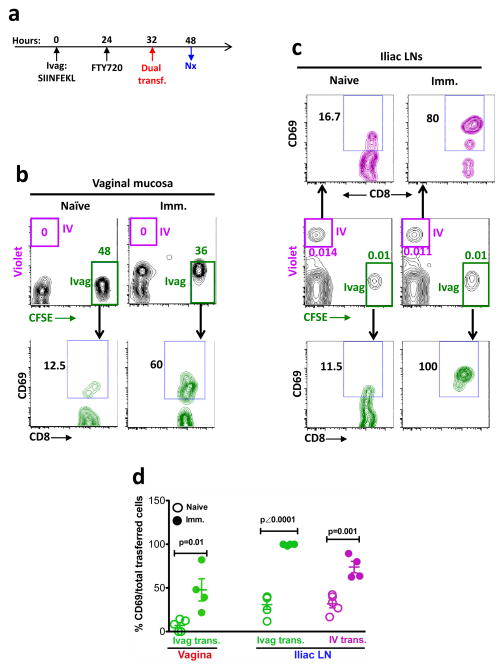
Figure 4. The CD69 expression of Ivag vs IV transferred OT-I CD8+ T cells in vaginal mucosa and iliac LNs at 48 hours PI.
(a) The experimental design. (b) The total and CD69-expressing transferred OT-I CD8+ T cells in vaginal mucosa. (c) The total and CD69-expressing transferred OT-I CD8+ T cells in iliac LNs. (d) The percentage (mean ± SEM) of CD69+ OT-I CD8+ T cells in each group. This is representative of 2 independently repeated experiments (n=5 per naïve group; n=4 per immunized group) with the same results. P value was generated using a Student’s t test.

