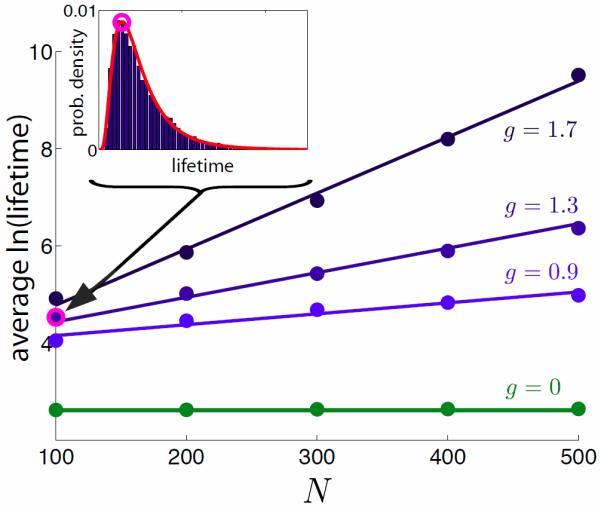
FIG. 5.

Exponential dependence on the network size N of the lifetime of the transient activity in the region with stable nonzero fixed points. Inset: Distribution of times to reach a fixed point for N=100, s=2.3 and g=1.3, shown with bars. The curve is a fit to a log-normal distribution. Main figure: The average of the logarithm of the time to reach a fixed point plotted as a function of N, for different g values. In all these examples, s = 2.3. For g = 0 the units are decoupled and the lifetime is independent of N. For g > 0, the lifetime is exponential in N.
