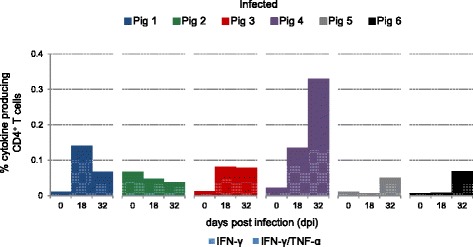
Figure 5.

Kinetics of PCV2-specific cytokine-producing CD4 + T cells following PCV2 infection. PBMCs isolated from PCV2 infected animals (not vaccinated, IN-group) before infection and 18 or 32 days post infection (dpi) were stimulated with PCV2-ORF2. CD4+ T cells were gated as described before and analysed for IFN-γ and TNF-α production. Stacked bar charts indicate percentages of cytokine-producing CD4+ T cells from individual animals. Hatched bars represent percentages of IFN-γ single-producing CD4+ T cells and filled bars illustrate percentages of IFN-γ/TNF-α co-producing CD4+ T cells within total CD4+ T cells.
