Figure 6.

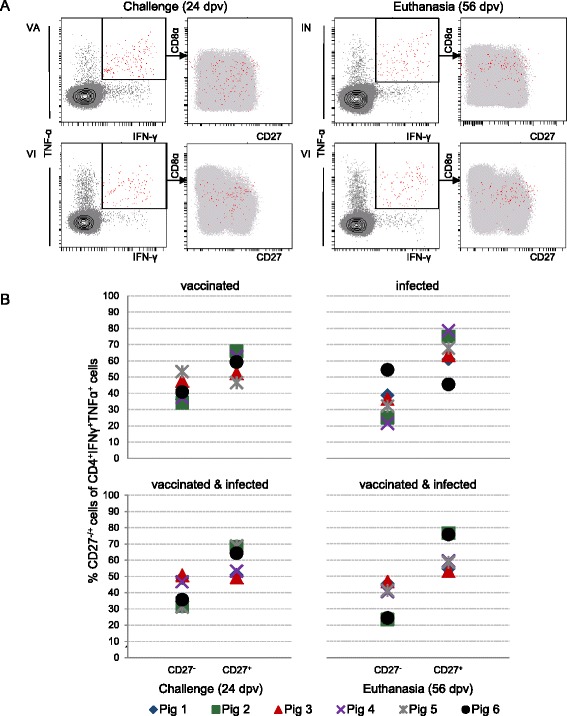
Memory phenotype of IFN-γ/TNF-α co-producing CD4 + T cells. A) CD4+ T cells were gated (not shown) and analysed for IFN-γ and TNF-α production following PCV2-ORF2 restimulation. IFN-γ/TNF-α double cytokine-producing CD4+ T cells were sub-gated and investigated for CD8α and CD27 expression. Representative data of animals VA6 (24 dpv), IN3 (56 dpv) and VI6 (challenge and euthanasia) are shown. B) Symbols in the scatter diagrams represent percentages of CD27− effector memory T cells (TEM) and CD27+ central memory T cells (TCM) within the subpopulation of IFN-γ/TNF-α co-producing T cells. Data is shown for individual animals of the vaccinated (VA), infected (IN) and vaccinated & infected (VI) group. The investigated time points correspond to 24 dpv (challenge) and 56 dpv (euthanasia).
