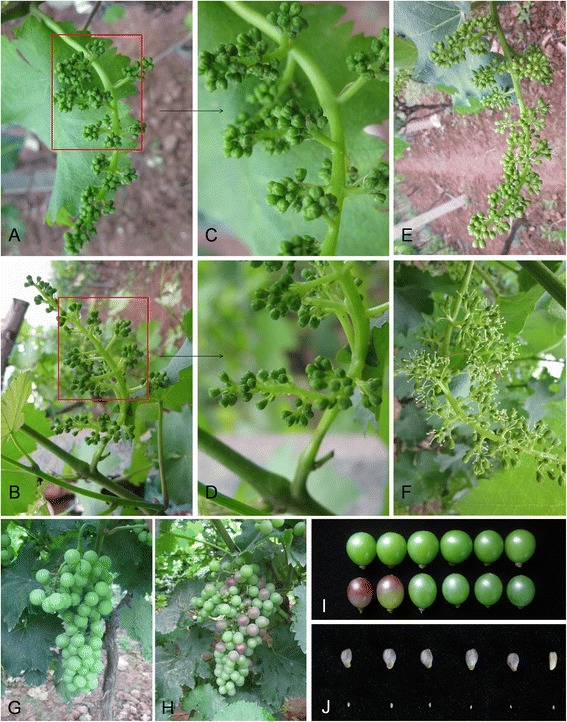
Figure 2.

Inflorescences, clusters, berries and seeds from grape cv. ‘Kyoho’ following GA 3 application. (A and B) Inflorescences from untreated control (A) and GA3-treated (B) plants 72 h after treatment; (C and D) Magnification of the portions of (A) and (B) enclosed in a red frame, respectively; (E and F) Inflorescences from untreated control (E) and GA3-treated (F) plants 8 d after treatment. (G and H) Clusters from untreated control (G) and GA3-treated (H) plants 57 d after treatment (45 d after full bloom, DAF); (I) Berries from untreated control (top-row) and GA3-treated (bottom-row) plants 57 d after treatment (45 DAF); (J) Seeds from untreated control (top-row) and GA3-treated (bottom-row) plants at maturity.
