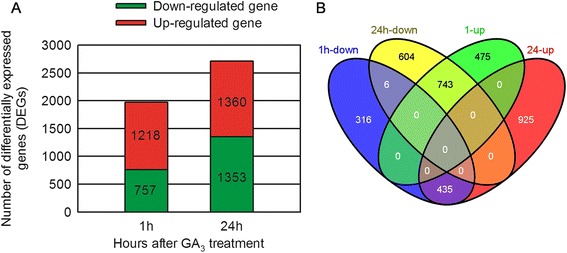
Figure 4.

Gene Expression Comparisons. (A) Number of DEGs (P value ≤ 0.05 and fold-change ≥ 2) between GA3-treated and untreated samples; (B) Number of DEGs between 1 h and 24 h following GA3 treatment. Overlapping sets of up-regulated or down-regulated genes between 1 h and 24 h following GA3 application are shown in the Venn diagram.
