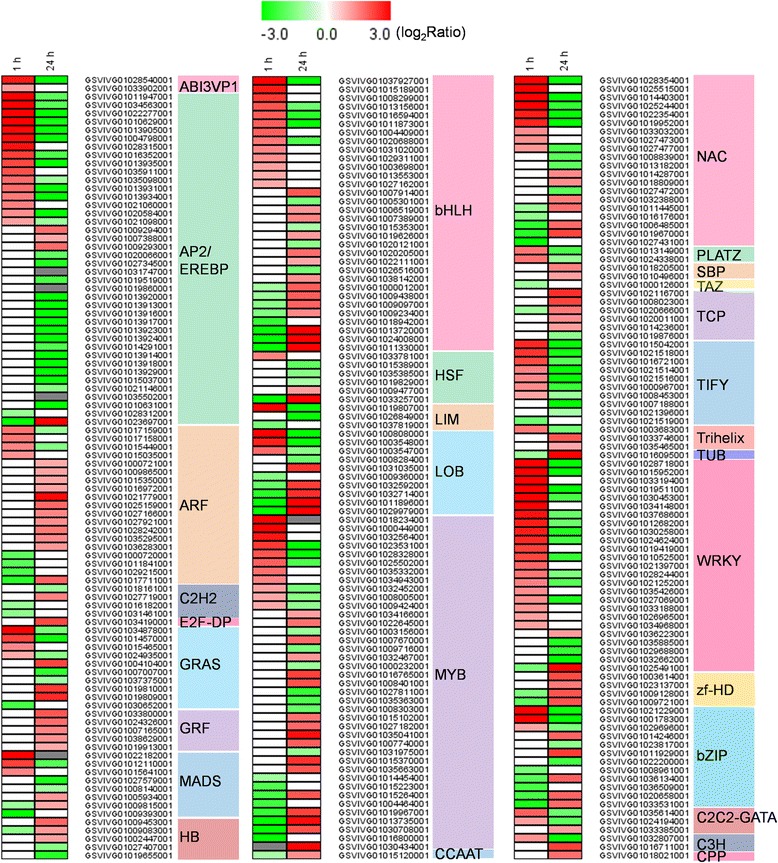
Figure 6.

Differentially expressed genes encoding transcription factors following GA 3 treatment. Different shades of red and green express the extent of the change according to the color bar provided (log2 ratio of control); white indicates no change; gray indicates that no transcript was detected in GA3-treated samples.
