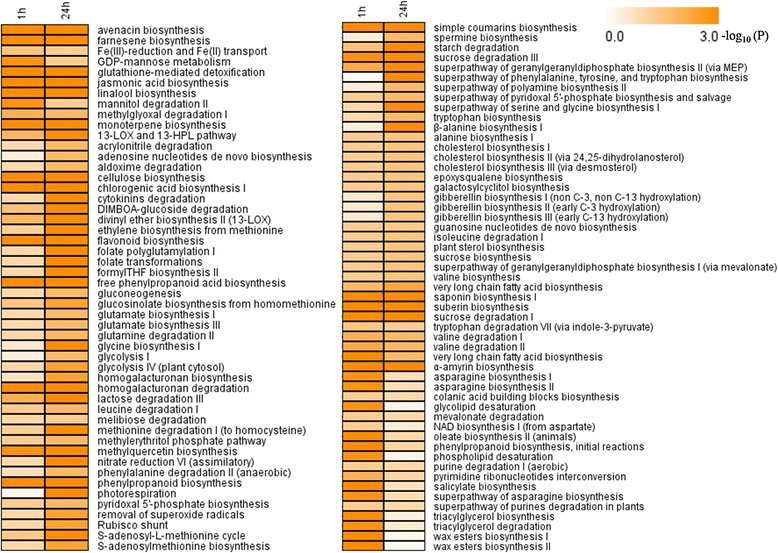
Figure 8.

Pathways controlled by genes exhibiting alterations in their expression levels after GA 3 treatment. Numbers on the color bar indicate -log (P value), where P value represents the significance. P value ≤0.05.

Pathways controlled by genes exhibiting alterations in their expression levels after GA 3 treatment. Numbers on the color bar indicate -log (P value), where P value represents the significance. P value ≤0.05.