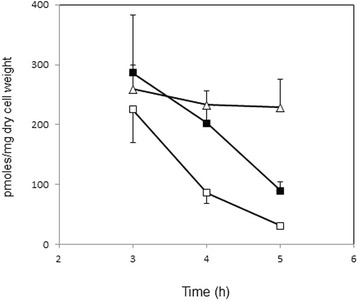
Figure 7.

Intracellular levels of FBP in the presence and absence of lctE. Cells of 168 (closed squares), 1A95 (degU32, open squares), and KI004 (degU32 lctE::spc, open triangles) cells were grown in the soytone–glucose medium, and intracellular metabolites were extracted at the indicated time points and were analyzed using CE–MS. Experiments were repeated independently for three times, and the mean values are shown with standard deviation.
