
Figure 1.
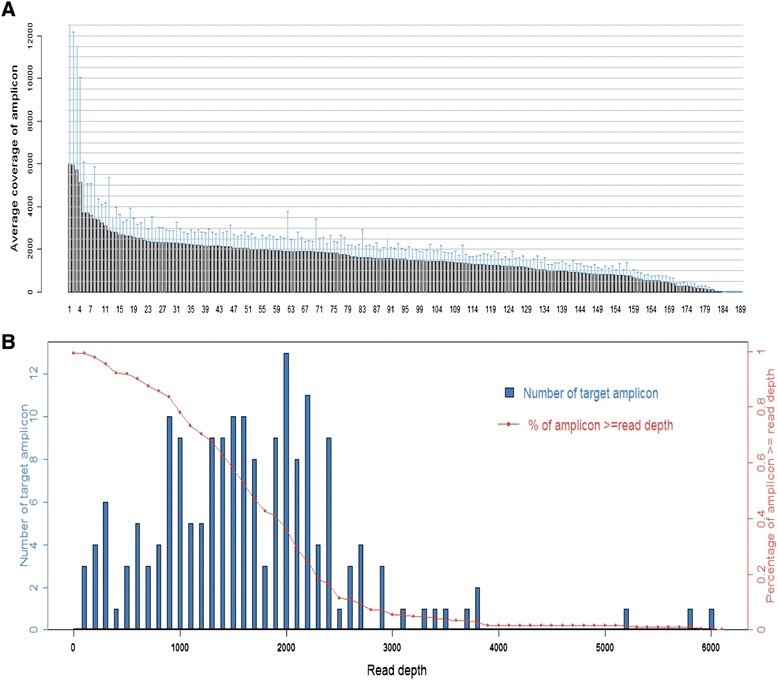
Sequence read distribution across 189 amplicons generated from 80 breast cancer samples, normalized to 300,000 reads per sample. (A) Average number of reads observed for each amplicon. (B) Number of targets with a given read depth, sorted in bins of 100 reads.