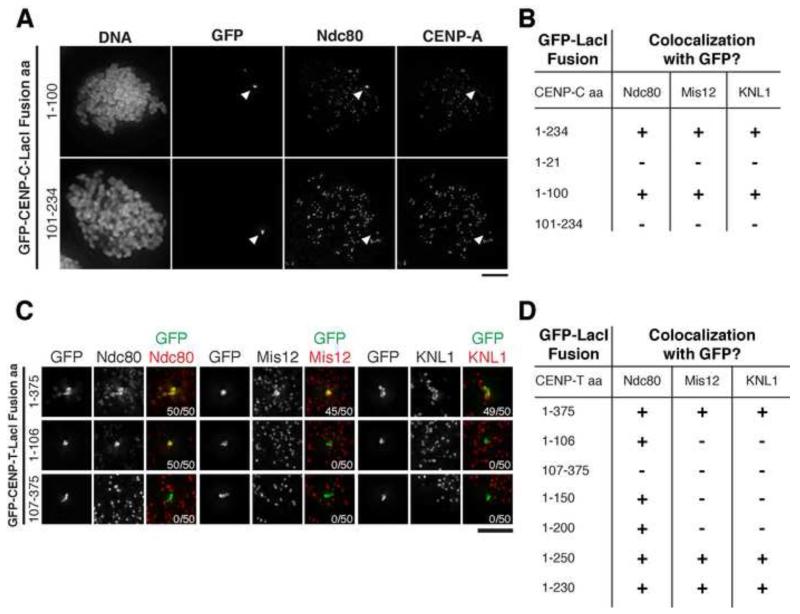
Figure 1. KMN network components display separable recruitment to CENP-T.
A) Immunofluorescence images showing positive (GFP-CENP-C (1-100)-LacI) or negative (GFP-CENP-C (101-234)-LacI) co-localization with anti-Ndc80 in nocodazole-treated cells. Chosen cells lacked overlap between the GFP focus and endogenous kinetochores marked by anti-CENP-A. Images were scaled independently to show the full range of data. Arrowheads indicate position of the GFP focus. B) Summary of immunofluorescence experiments assessing co-localization of KMN components with the indicated CENP-C-LacI fusions. >90% of cells display indicated behavior (N = 50 cells/condition). C) Representative immunofluorescence images showing localization of GFP-CENP-T-LacI foci and KMN components in nocodazole-arrested mitotic cells. Images were scaled independently to show full range of data. Numbers in lower right indicate number of mitotic cells showing co-localization. D) Summary of co-localization of KMN components with CENP-T-LacI fusions. >90% of cells observed display indicated behavior (N = 50 cells/condition). Scale bars, 5 μm. See also Figures S1 and S2.

