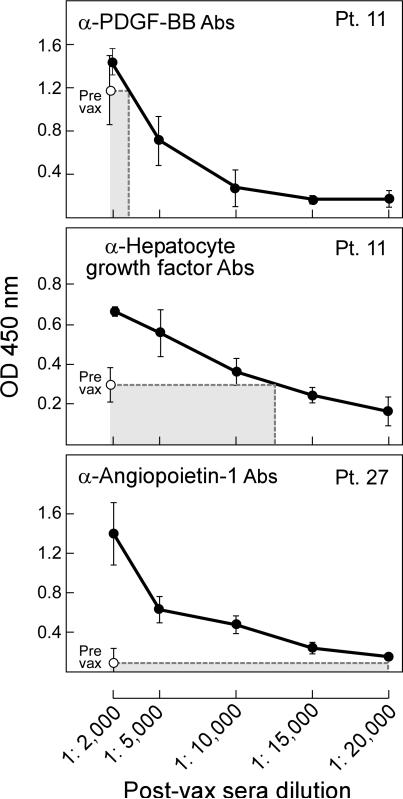
Figure 2. Vaccination early after allogeneic HSCT increases antibodies to angiogenic cytokines.
Representative examples are shown for comparisons of peak post-vaccination responses with pre-vaccination levels, illustrating from top to bottom modest (“+”), moderate (“++”), or strong (“+++”) responses. Examples of reactivity to PDGF, hepatocyte growth factor, and angiopoietin-1 are presented for patients 11 and 27. See Table 2 for a complete analysis of antibody induction for each angiogenic cytokine and patient. Post-vaccination sera samples showing the highest reactivity to an individual cytokine were serially diluted and compared with pre-vaccination sera samples. A horseradish peroxidase conjugated anti-human IgG (Fab)2 was used to detect the patient antibodies, and Tyramide was added to amplify the signal. Absorbance was measured at 450 nm. Similar results were observed in at least three independent assays.

