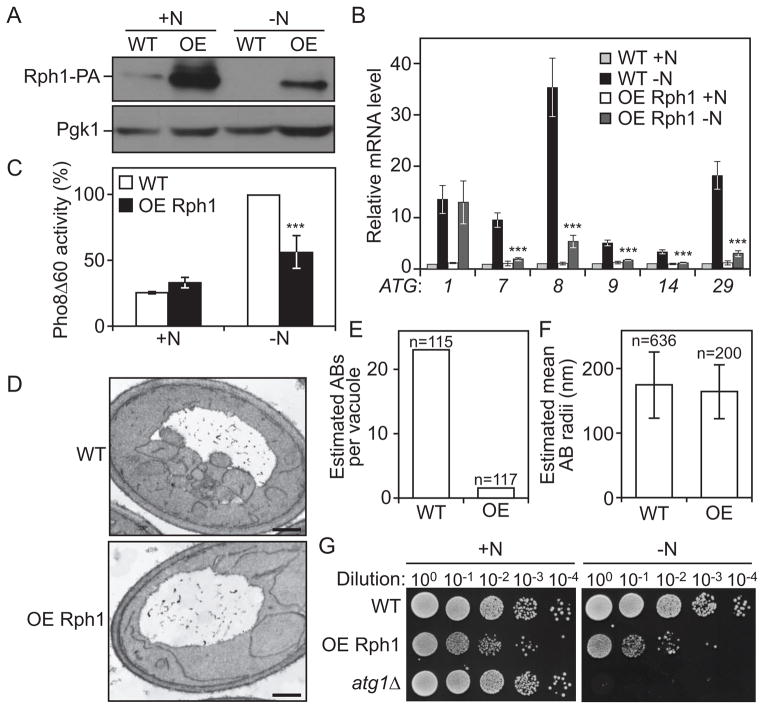
Figure 4. The overexpression of Rph1 inhibits autophagy and decreases cell survival in nitrogen starvation conditions.
(A–C) Overexpressed Rph1 (ZEO1p-RPH1-PA) results in a block in ATG genes expression and autophagy flux. Rph1-PA cells (WT, YAB323, SEY6210) and cells overexpressing Rph1-PA (OE Rph1, YAB329) were grown in YPD (+N) until mid-log phase and then starved for nitrogen (−N).
(A) Cells were starved for 2 h, and protein extracts were analyzed by western blot with either an antibody that recognizes PA or anti-Pgk1 (loading control) antiserum.
(B) Total RNA of cells in mid-log phase (+N) as well as after 1 h of nitrogen starvation (−N) was extracted and the mRNA levels were quantified by RT-qPCR. The mRNA level of individual ATG genes was normalized to the mRNA level of the corresponding gene in Rph1-PA cells (WT), which was set to 1. Data represent the average of 3 independent experiments ± standard deviation.
(C) The Pho8Δ60 activity was measured and normalized to the activity of Rph1-PA cells (WT) after 2 h of nitrogen starvation (−N), which was set to 100%. Error bars indicate standard deviation of 3 independent experiments.
(D–E) Rph1 overexpression blocks the biogenesis of autophagic bodies. Wild-type cells (WT, FRY143) and cells overexpressing Rph1 (OE Rph1, YAB346) were imaged using transmission electron microscopy after 2 h of nitrogen starvation.
(D) Representative TEM images showing a reduced accumulation of autophagic bodies in the vacuole of cells overexpressing Rph1 compared to wild type. Scale bar, 500 nm.
(E) Estimated average number of autophagic bodies (AB) per vacuole. Estimation was based on the number of autophagic body cross-sections observed by TEM [50]. Over 100 unique cells per strain were captured and analyzed.
(F) The estimated mean radii (in nm) of the original autophagic bodies (AB) observed by TEM in wild-type and OE Rph1 cells was analyzed as in (E).
(G) Rph1 overexpression reduces cell survival after prolonged nitrogen starvation. Rph1-PA cells (WT, YAB323, SEY6210), cells overexpressing Rph1-PA (OE-Rph1, YAB329) and atg1Δ cells (WLY192) were grown in YPD (+N) until mid-log phase and then starved for nitrogen for 15 days (−N). Dilutions as indicated were grown on YPD plates for 2 days, then imaged.

