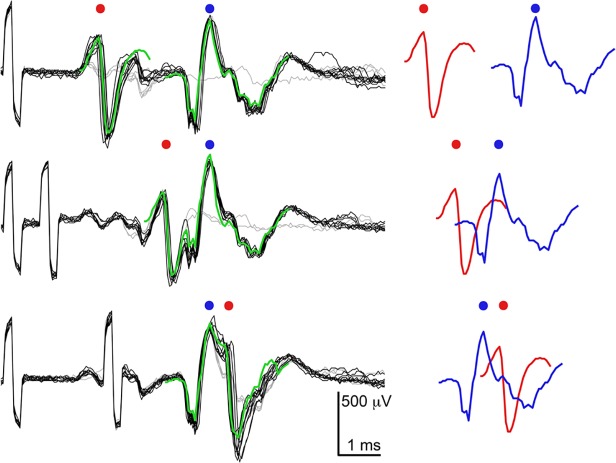
Fig 9. Addition of single spike waveforms from stimulation of two somas reproduces complicated wave shapes.
Top trace shows the two stimulations far apart in time, so that the waveforms do not yet overlap. The middle and bottom traces show two different overlaps. The peaks of the individual waveforms are marked with dots corresponding to their color. Addition of the individual waveforms, shown in red and blue on the right, accurately reproduced the shape recorded in the channel as a result of two stimulations. The s-shaped pulses at the beginning of each trace are stimulation artefacts: the first one (the only one shown in the top trace) corresponds to the stimulus that evoked the blue spike, and the second one (not seen in top trace since it would be to the left of the signal shown) corresponds to the red spike. Some stimulations did not evoke spikes, and they are shown in grey.

