
Figure 2.
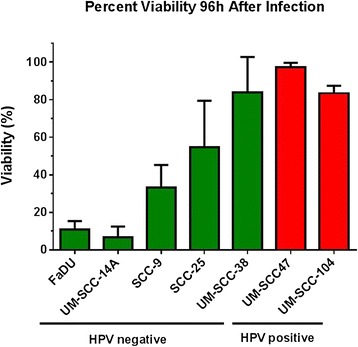
Percentage of viable cells of various HNSCC cell lines 96 h after addition of 2.40×10 8 PFU/mL dilution of reovirus. Mean values were taken from three or more independent experiments. Error bars represent standard deviation.
Official websites use .gov
A
.gov website belongs to an official
government organization in the United States.
Secure .gov websites use HTTPS
A lock (
) or https:// means you've safely
connected to the .gov website. Share sensitive
information only on official, secure websites.
Percentage of viable cells of various HNSCC cell lines 96 h after addition of 2.40×10 8 PFU/mL dilution of reovirus. Mean values were taken from three or more independent experiments. Error bars represent standard deviation.