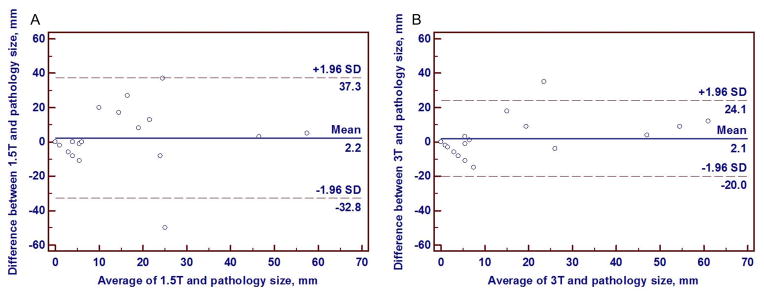
Fig. 2.

Bland-Altman plots of DCIS displaying the differences in lesion sizes versus pathology sizes on 1.5 tesla (T) breast MRI (A) and 3T breast MRI (B). Note that the limits of agreement with pathology size are narrower for 3T size (B) than 1.5T size (A), indicating greater agreement of 3T DCIS lesion sizes with final pathology sizes.
