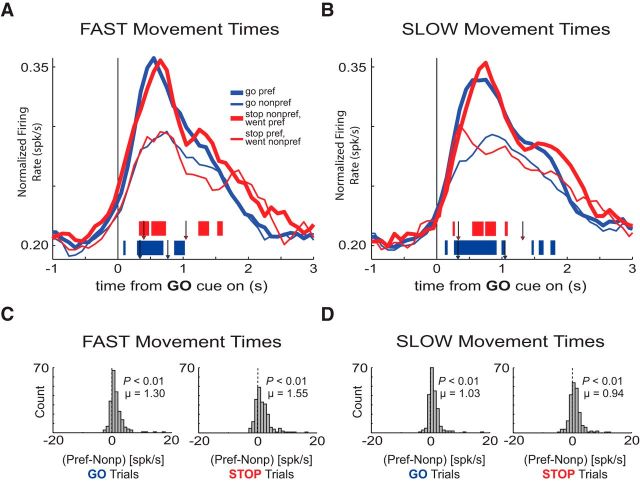
Figure 3.
Firing of increasing-type OFC neurons was related to movement time. A, B, Population histograms of all increasing-type OFC neurons (n = 209). Movement time median split for each direction in each trial-type yields one histogram of FAST trials (A) and one of SLOW trials (B) each aligned on GO cue onset. Tick marks represent time points of statistically significant direction firing (preferred vs nonpreferred direction) for GO trials (blue) or STOP trials (red) analyzed by sliding a 100 ms window every 10 ms (t test, p < 0.01). Left-most arrows depict average latency to unpoke after GO cue illumination for STOP trials (red arrowheads; FAST = 397 ms; SLOW = 330 ms) and GO trials (blue arrowheads; FAST = 338 ms; SLOW = 326 ms) for the analyzed sessions. Right-most arrows depict average latency to well entry after GO cue illumination for STOP trials (red arrowheads; FAST = 1043 ms; SLOW = 1318 ms) and GO trials (blue arrowheads; FAST = 766 ms; SLOW = 1047 ms) for the analyzed sessions. C, Direction index distributions calculated without dividing by the sum of preferred and nonpreferred activity. This procedure deviates slightly from that of Figures 2 and 4 due to more frequent extreme difference scores after the number of trials for each distribution was split in half. Direction distributions encompass all FAST movements during GO trials (left) and STOP trials (right). D, Direction index distributions for SLOW trials. Other conventions as in C. Distributions are determined to be significantly different from zero via Wilcoxon (p < 0.05). Distributions are determined to be significantly different from one another via Wilcoxon (p < 0.05).

