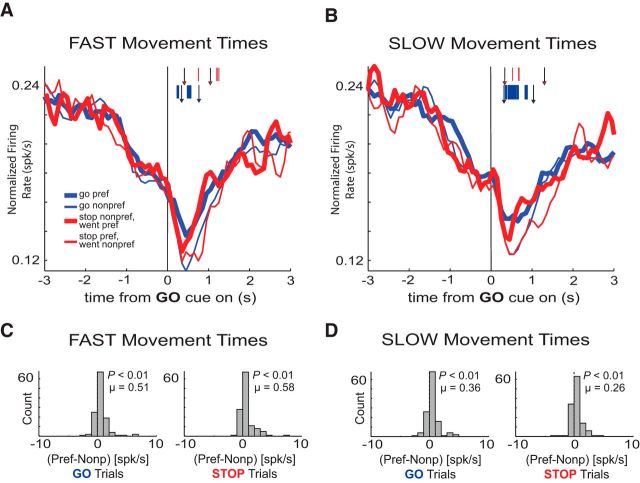
Figure 6.
Firing of decreasing-type OFC neurons was related to movement time. A, B, Population histograms of all decreasing-type OFC neurons (n = 131). Tick marks represent time points of statistically significant direction firing (preferred vs nonpreferred direction) for GO trials (blue) or STOP trials (red) analyzed by sliding a 100 ms window every 10 ms (t test, p < 0.01). Left-most arrows depict average latency to unpoke after GO cue illumination for STOP trials (red arrowheads; FAST = 407 ms; SLOW = 338 ms) and GO trials (blue arrowheads; FAST = 344 ms; SLOW = 322 ms) for the analyzed sessions. Right-most arrows depict average latency to well entry after GO cue illumination for STOP trials (red arrowheads; FAST = 1041 ms; SLOW = 1310 ms) and GO trials (blue arrowheads; FAST = 764 ms; SLOW = 1042 ms) for the analyzed sessions. Other conventions as in Figure 3. C, D, All conventions as in Figure 3.

