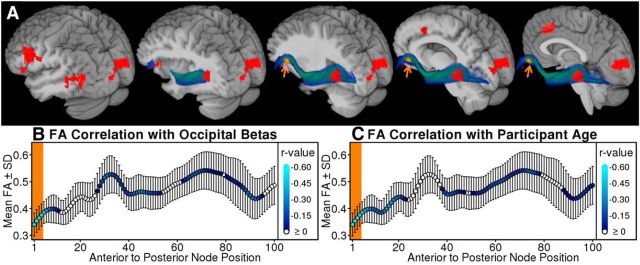
Figure 4.
FA was lower in the left anterior IFOF for the participants with higher occipital betas and for the older participants. A, The left IFOF rendered as a spatially normalized and averaged blue-green tract with the structural image peeled away in sagittal slices toward the midline. Red indicates voxels with BOLD related to subsequent word recognition. The IFOF projects between the frontal operculum and the occipital cortex, close to the clusters identified using the GLMM. B, C, Average FA and SDs are plotted for each position and filled lighter blue points that indicate stronger negative correlations between FA and occipital betas (B) or participant age (C). The orange background (B, C) indicates significant negative correlations that were corrected for multiple comparisons using nonparametric permutation tests (corrected α = 0.05; Nichols and Holmes, 2002). The nodes with FA that were significantly related to occipital betas (A; positions 1–4) were spatially transformed from native space and rendered onto the study template as the orange spot with arrows (A). Pooled FA scores (positions 1–4) were related to occipital betas after controlling for mean distance to gray matter (partial r = −0.42, p = 0.02) and participant age (partial r = −0.58, p < 0.001), indicating that cortical atrophy and volume averaging did not account for the FA results. This interpretation is also supported by tensor shape data (Westin et al., 2002). Tensor planarity can also reflect volume averaging and did not account for the associations between pooled FA and occipital betas (partial r = −0.62, p < 0.001) or age (partial r = −0.62, p < 0.001). In contrast, tensor linearity could explain the occipital beta associations with FA (partial r = −0.19, p = 0.31), indicating that participants with stronger visual cortex effects and lower FA scores also had diffusion tensors with less uniform orientation in the left anterior IFOF.

