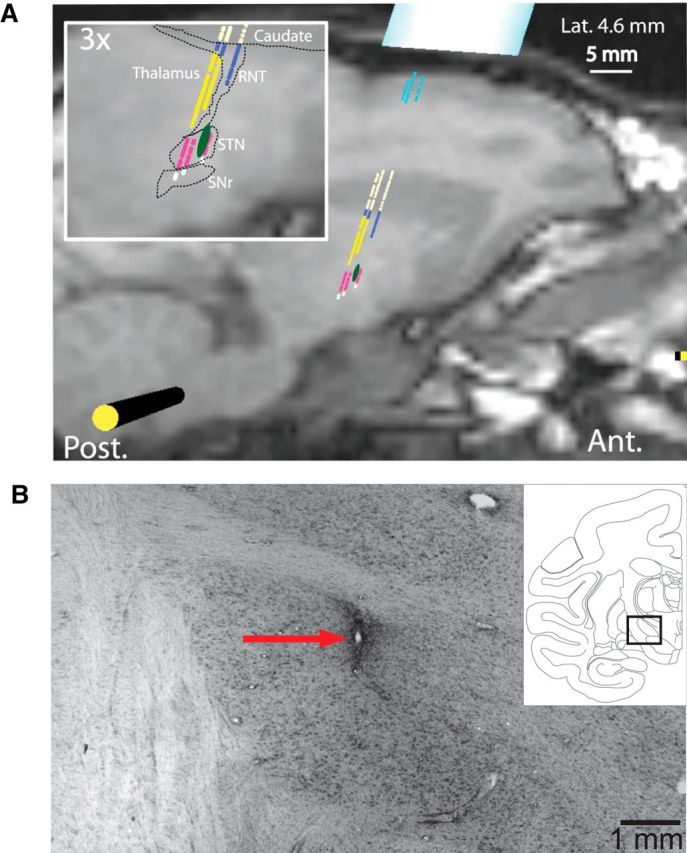
Figure 1.

Localization of stimulating electrodes. A, Parasagittal structural MRI of Monkey B through the STN overlaid with results from microelectrode mapping. The colors of markers indicate the electrophysiologically determined cell type: light blue represents cortex; light yellow represents caudate nucleus; dark blue represents reticular nucleus of thalamus (RTN); yellow represents thalamus; pink represents STN; white represents substantia nigra pars reticulata (SNr). Green oval represents approximate location of stimulating electrode. B, Nissl-stained section from Monkey D showing the location of the stimulating electrode within the STN. Red arrow indicates region of gliosis caused by electrode. Inset, Line drawing indicating the brain region shown in the larger figure.
