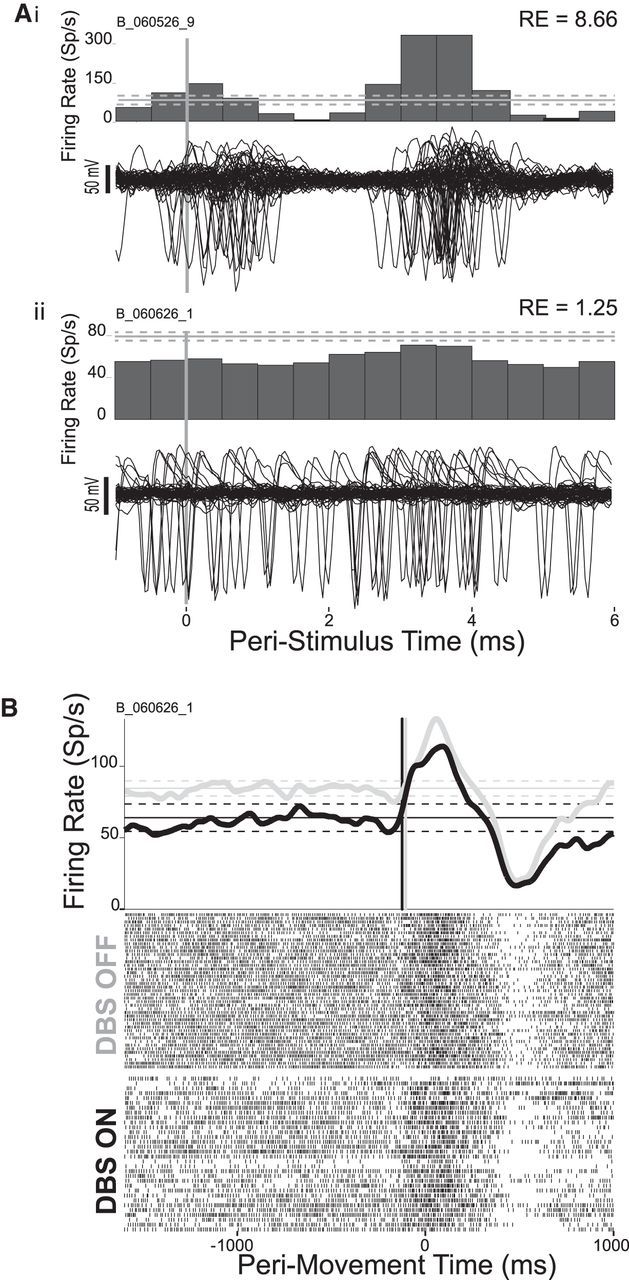
Figure 2.

Exemplar effects of STN-DBS (A) and movement (B) on pallidal neuron activity. A, Overlain raw microelectrode signals from 50 consecutive STN-DBS stimuli (vertical gray line). No shock artifact is evident due to effective operation of the artifact subtraction algorithm during data collection. Peristimulus histograms (above) illustrate phasic driving of a unit (i) and a tonic decrease in firing (ii). Unit i is highly entrained to the stimulation frequency (RE = 8.66), whereas unit ii is poorly entrained (RE = 1.25). Horizontal solid lines indicate mean unit firing rate (±95% CI horizontal dashed lines) from the DBS-off condition. B, Perimovement activity of the same unit shown in Aii, aligned to the onset of movements (time 0) performed during the DBS-off (gray SDF and top rasters) and DBS-on (black SDF and bottom rasters) periods. Horizontal solid lines indicate mean control period firing rates (±95% CI horizontal dashed lines) for DBS-off and DBS-on periods. Vertical lines indicate onset times for significant (p < 0.01) movement-related change in the SDF. Gray vertical line and black vertical line indicate DBS-off and DBS-on SDFs, respectively.
