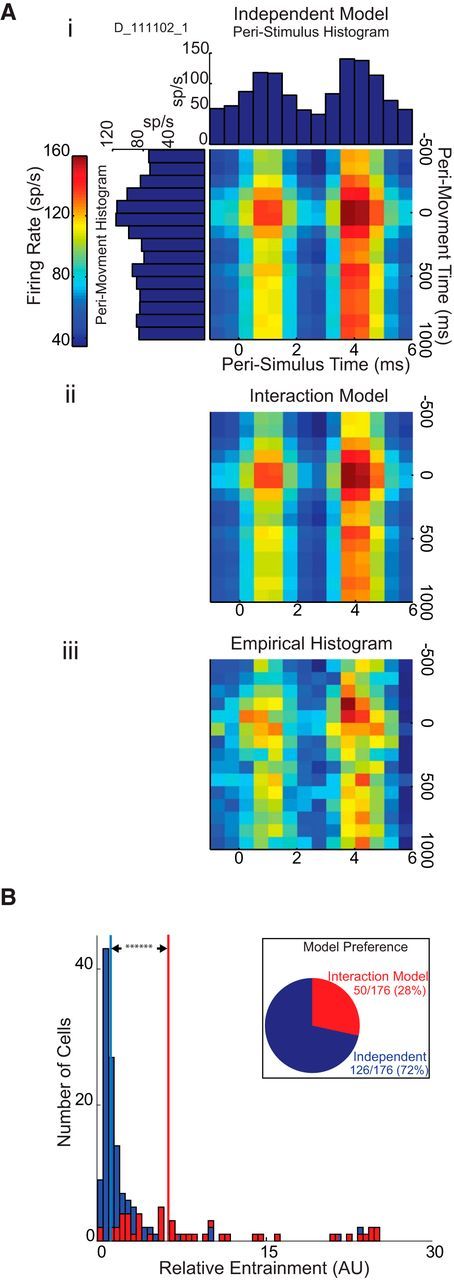
Figure 4.

Movement and stimulation are orthogonal contributors to GP cell firing. Ai, Construction of Independent Model joint histogram from peristimulus and perimovement, 1-dimensional histograms. The peristimulus and perimovement histograms were derived from the recordings of a pallidal neuron. The binned firing rates of these 1-dimensional histograms were normalized and multiplied by the regression coefficients produced using the Independent Model to produce the 2-dimensional histogram. Aii, The 2-dimensional histogram, for the same cell shown in Ai, as predicted by the Interaction Model. Aiii, An empirical joint histogram produced for the same neuron by binning the firing rate of the cell relative to peristimulus and perimovement times. B, Distribution of Interaction Model Preferring cells and Independent cells, in terms of RE. Inset, Model preference as percentage of cells tested. Red bars represent cells that were modeled significantly better by Interaction Model as determined by the AIC value. Blue bars represent Independent cells. Vertical red line indicates median RE value for cells that were modeled significantly better by Interaction Model. Vertical blue line indicates median RE value for Independent cells.
