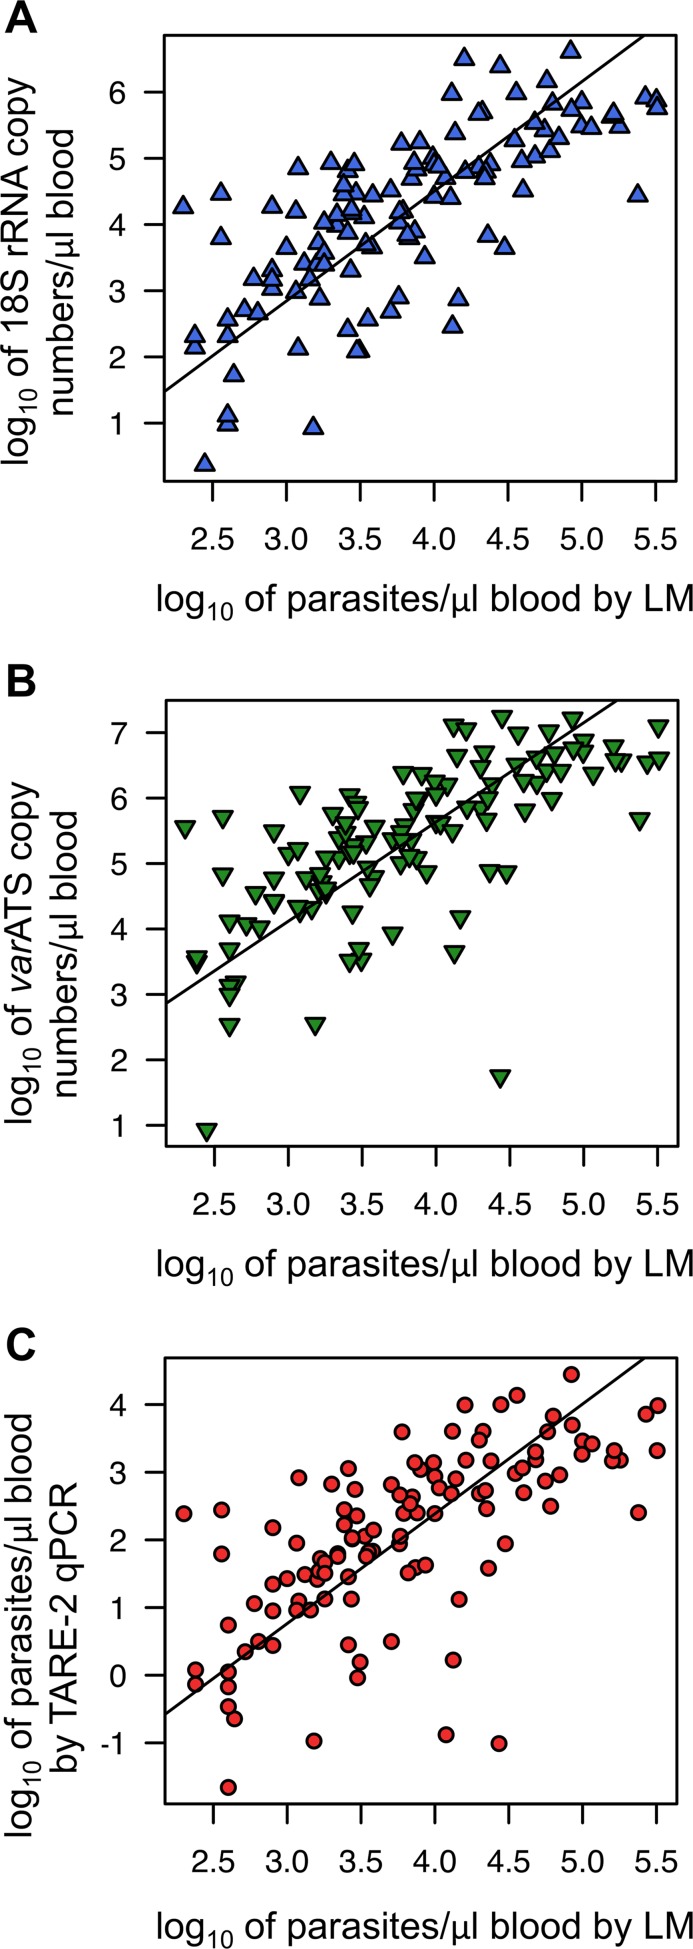
Fig 4. Correlation of parasite quantification by the three qPCR assays and light microscopy.
Parasite quantities determined by 18S rRNA (A), varATS (B), and TARE-2 (C) qPCRs and their correlation with parasite density by LM. Quantification by PCR was done relative to copy numbers of plasmid standards (18S rRNA, varATS) or a parasite dilution row (TARE-2). For quantification by LM, 200 fields of a thick film were examined, and parasite density was calculated assuming 8,000 leucocytes/μl blood. Pearson’s product-moment correlation was used to assess correlation strength, and Deming regression was used to calculate regression lines.

