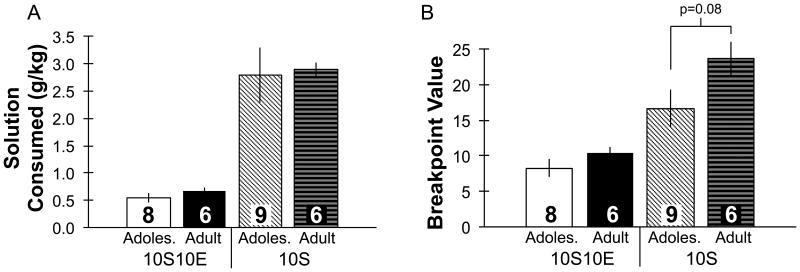
Figure 5.
Operant self-administration of sweetened ethanol or sucrose only solutions in adolescents and adults using a progressive ratio model. Adolescent and adults did not differ in the amount of ethanol or sucrose consumed (g/kg; A) or in the breakpoint values (B) obtained (for 10S groups adults trended toward higher breakpoint values compared to adolescents, p=0.08); values for intake and breakpoint were greater in sucrose compared with ethanol groups regardless of age. 10S10E = 10% sucrose +10% ethanol, 10S = 10% sucrose, Adoles. = Adolescent. Group numbers are displayed inside bars. Bars represent mean ± SEM.

