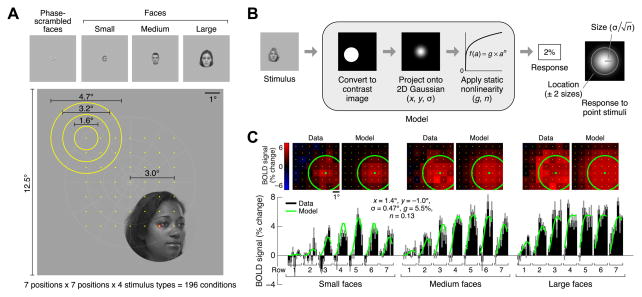
Figure 1. Compressive spatial summation accurately models responses in VTC.
(A) Stimuli. Subjects viewed faces while fixating centrally. Faces varied systematically in position (centers indicated by yellow dots) and size (sizes indicated by yellow circles). During each trial, face position and size were held constant while face identity and viewpoint were dynamically updated. (B) Compressive spatial summation (CSS) model. The response to a face is predicted by computing the spatial overlap between the face and a 2D Gaussian and then applying a compressive power-law nonlinearity. The model includes two parameters (x, y) for the position of the Gaussian, a parameter (σ) for the size of the Gaussian, a parameter (n) for the exponent of the nonlinearity, and a parameter (g) for the overall gain of the predicted responses. (C) Example voxel (left IOG, subject 1). Top row: Responses arranged spatially according to face position. Bottom row: Responses arranged serially for better visualization of measurement reliability and goodness-of-fit of CSS model. BOLD response magnitudes (black bars; median across trials ± 68% CI) are accurately fit by the model (green line). Note that a single set of model parameters accounts for the full range of the data. See also Figure S1.

