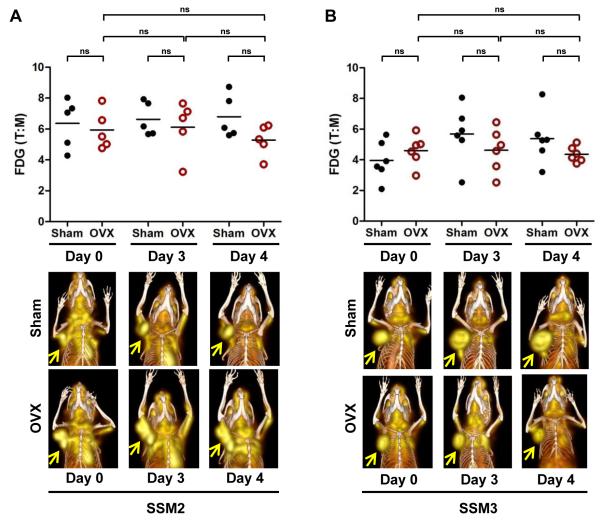
Figure 5. Longitudinal [18F]FDG μPET/CT imaging of SSM2 (A) and SSM3 (B) mammary tumors.
(top panels) Mice bearing SSM2 (A) or SSM3 (B) tumors were scanned 1 hr after [18F]FDG injection. % ID/g of tumor and muscle were calculated. Tumor to muscle ratio (T:M) of FDG uptake in SSM2 (n = 5 per group) (A) and SSM3 (n = 6 per group) (B) tumors from Sham and OVX mice before surgery (Day 0) and on Days 3 and 4 post-surgery. ns = not significant. (bottom panels) 3D maximum intensity projection (MIP) from co-registered μPET and CT images of representative mice bearing SSM2 (A) and SSM3 (B) mammary tumors. Serial images from the same mouse in each group are shown. Arrows indicate tumors. Representative results of two independent studies are shown.

