
Figure 5. The stability of BMAL1 is regulated by Ube3a expression in vivo.
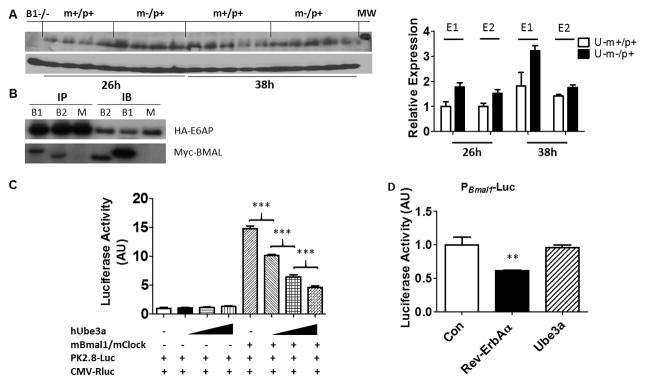
A, Left panel: Immunoblots of BMAL1 in hypothalamus of U-m-/p+ and WT mice placed in DD for 26 and 38 h (CT14 & CT2, respectively). β-Actin serves as the loading control (each lane comes from a separate mouse, one representative immunoblot is shown). Right panel: Densitometric analyses of the BMAL1 expression for two independent experiments (E1 and E2; an immunoblot for E2 is shown in the left panel). BMAL1 expression of WT at DD 26 h is set as 1 (“B1−/−” = Bmal1−/−; “MW” = a protein band of molecular weight 75 kD). Two-way ANOVA statistical analyses show significant differences for both genotype (WT vs. U-m-/p+, p = 0.0013) and for time (DD 26h vs. DD 38h, p = 0.0029).
B: Interaction between BMAL1 (B1) or BMAL2 (B2) and E6-AP in HEK293 cells transfected with Myc-mBmal1/2 and HA-hUbe3a. Immunoprecipitates were prepared using an anti-HA antibody and the immunoprecipitates (IP) and original cell lysates (IB) were separated by electrophoresis and immunoblotted with either anti-HA (for E6-AP) or anti-Myc (for BMAL1 or BMAL2)(M = mock control, pCDNA3.1 vector).
C: Ube3a expression reduces BMAL1/CLOCK activation of E-box reporter PPK2.8::Luc in HEK 293 cells. Data (mean ± SEM, n=4) were normalized to the PCMV::Rluc control and expressed relative to empty vector controls. ***p<0.01, One-way ANOVA, post hoc Tukey test.
D: Ube3a expression does not affect the promoter activity of Bmal1. Data are mean ± SEM (n =4) of firefly luciferase activity (PBmal1-Fluc) normalized to the PCMV::Rluc control. ** p<0.01 compared with empty vectors control (Con), which was set to a value of 1.0, one-way ANOVA, post hoc Tukey test. See also Figures S4 and S6.