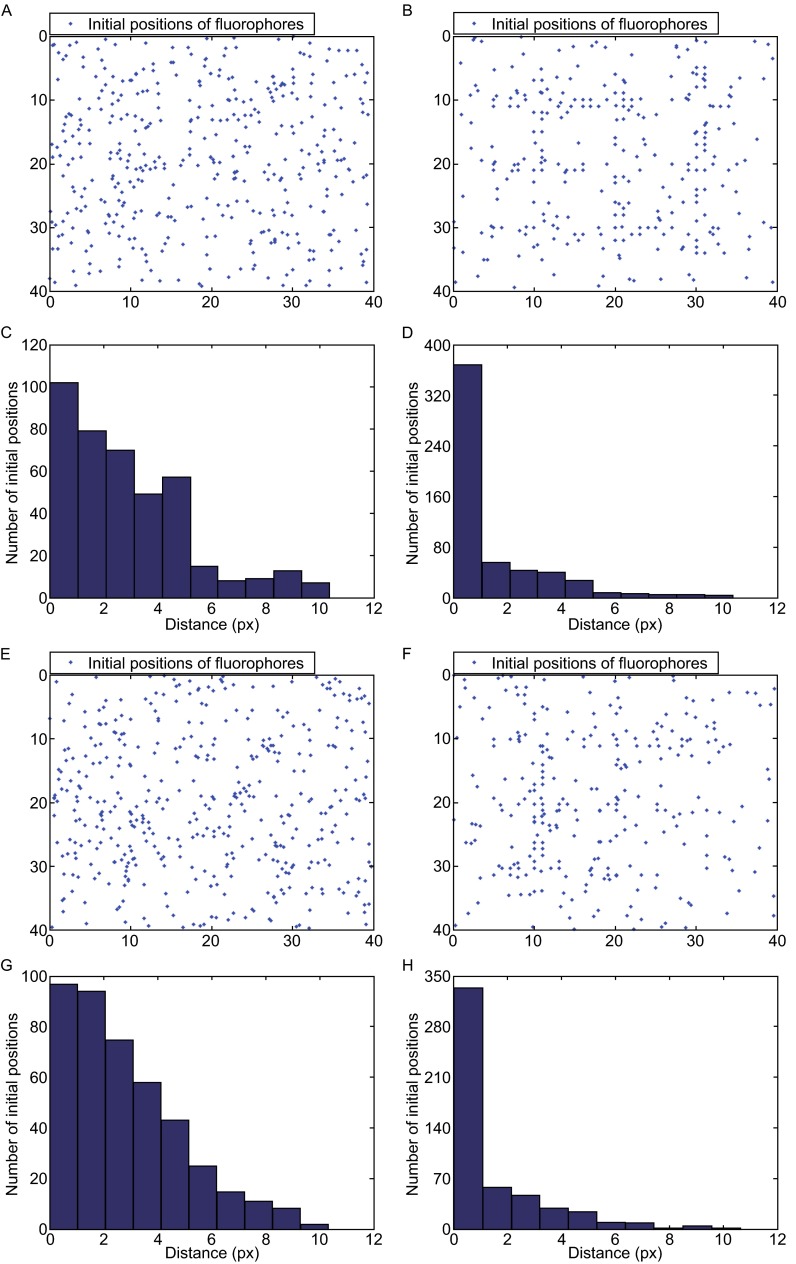
Figure 5.
Comparison of the distribution of initial positions for the grid dataset (A–D) and the gradient grid dataset (E–H). (A) Distribution of initial positions using 3B. (B) Distribution of initial positions using FID3B. (C) Distances from initial positions to image contour in 3B. (D) Distances from initial positions to image contour in FID3B. (E–H) are interpreted as the same as (A–D)

