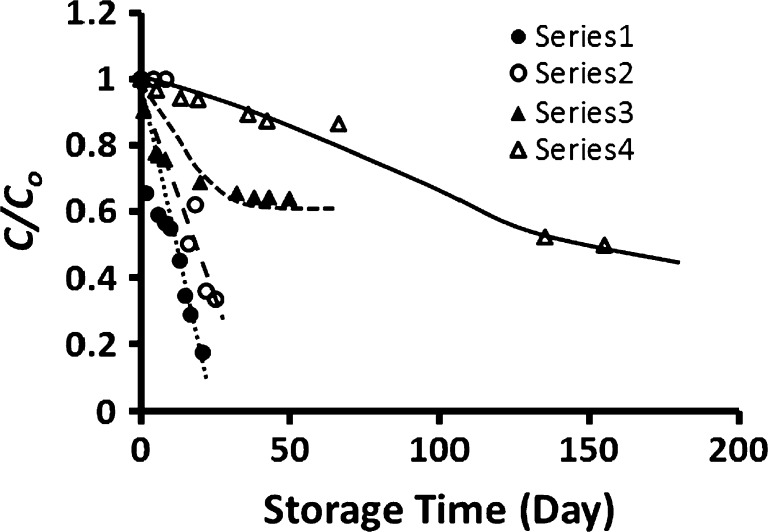
Fig. 2.
Selected plots of concentration ratio (C/C o) as a function of storage time. Series1: Fresh capsicum (X w: 94 g/100 g sample) stored at 5 °C, Series2: Fresh capsicum (X w: 94 g/100 g sample) stored at −40 °C as a function of storage time, Series3: Freeze-dried capsicum (X w: 15 g/100 g sample) stored at room 5 °C, Series4: Freeze-dried capsicum (X w: 5 g/100 g sample) stored at room 5 °C as a function of storage time (X w: moisture content)

