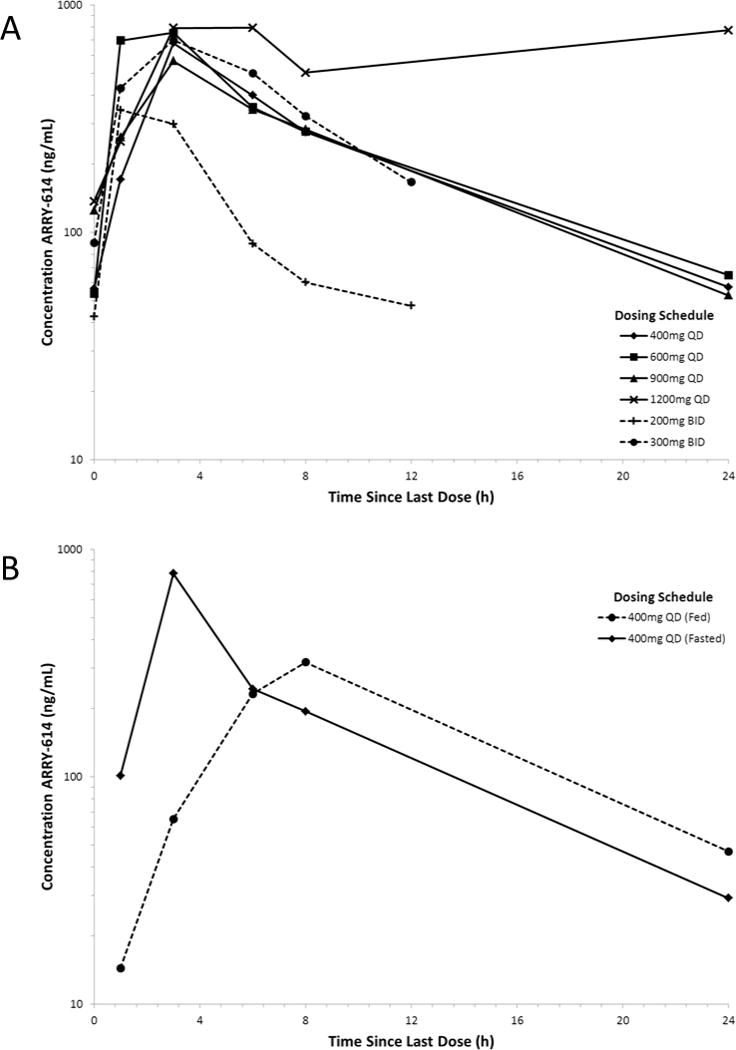
Figure 1. ARRY-614 Plasma Concentration-Time Profiles.

(A) Geometric mean concentration-time profile represented from each dose level in the dose escalation phase. (B) Geometric mean concentration-time profile after administration of 400 mg ARRY-614 under both fed and fasted conditions.
