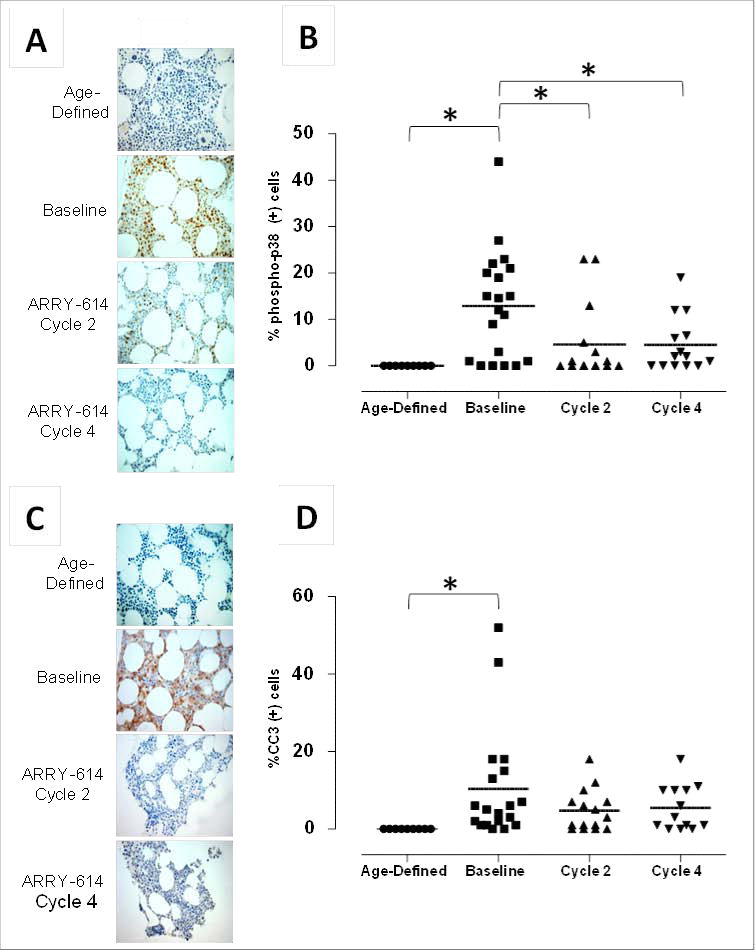
Figure 2. Bone marrow levels of p-p38 and CC3.

(A) Representative IHC photomicrographs for p-p38 for an individual MDS patient at baseline and after 2 or 4 cycles of treatment with ARRY-614. (B) Nine representative samples from age-comparable, normal subjects (‘Age-Defined’) were evaluated for p-p38 for comparison to MDS patient samples. (C) Representative IHC photomicrographs for CC3 for an individual MDS patient following treatment with ARRY-614. (D) CC3 expression in 9 representative samples from age-comparable, normal subjects (‘Age-Defined’) were evaluated for comparison to MDS patient samples. Data are represented as mean values analyzed by ANOVA, Tukey-Kramer post hoc (*P<0.05).
