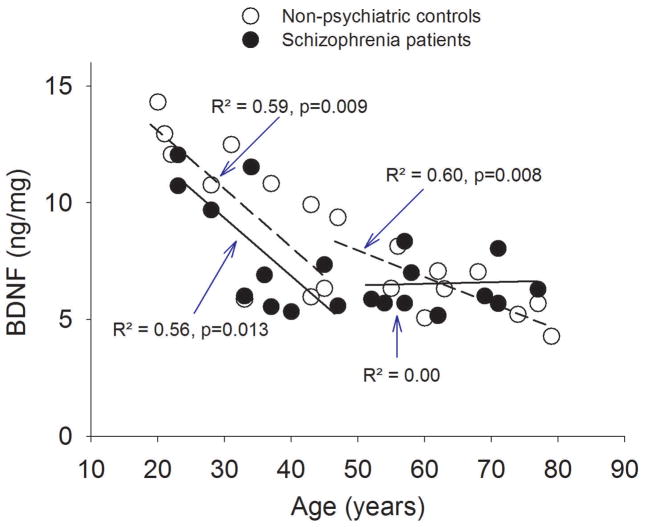
Figure 2.
Exploratory, secondary analysis using a bi-modal interpretation of Figure 1 when splitting the groups into first 30 years of adult life (20 to 50 years and second 30 years (50 to 80 years). Here, the slopes of decline between the patients and non-psychiatric comparisons were similar in younger age but statistically different in older age. Y axis is prefrontal cortex BDNF. Dotted lines and open circles: non-psychiatric comparisons; solid lines and solid circles: schizophrenia patients.

