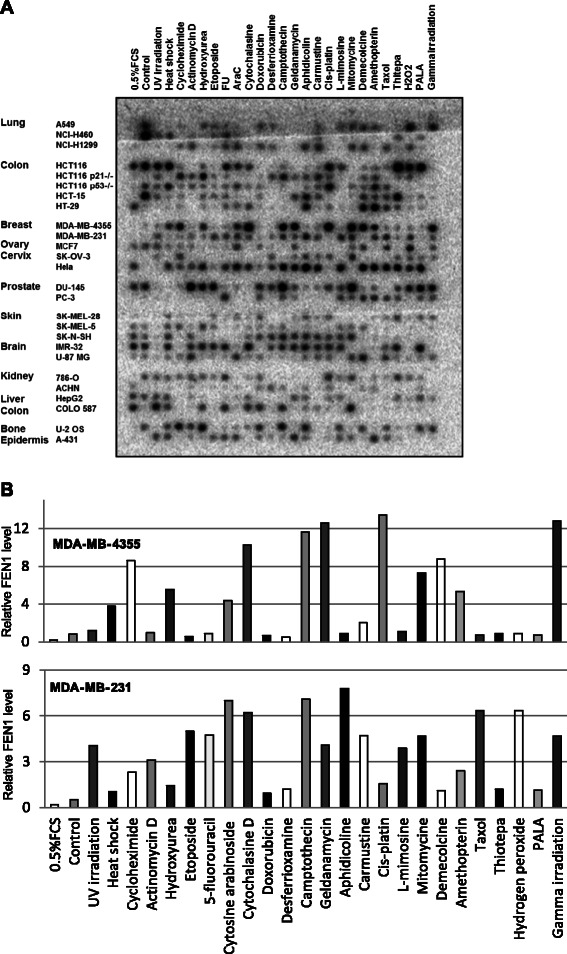
Figure 5.

FEN1 gene expression in response to chemotherapeutic drug and DNA damage agent treatments. A. Macro-image of hybridization of the 32-P-labeled FEN1 ORF DNA fragment with the expression array, which contains cDNA from different cells lines treated with different DNA-damaging agents. In the control hybridization, 32-P-labeled ubiquitin ORF DNA fragment was used [38]. B. The relative fold changes of the density of the hybridized spots. All FEN1 hybridization signals were normalized with corresponding ubiquitin signals. In each cell line, the normalized signal in the untreated control sample was arbitrarily set as 1, and the fold change was calculated by comparing the normalized signal in a specific sample to that of the untreated control sample.
