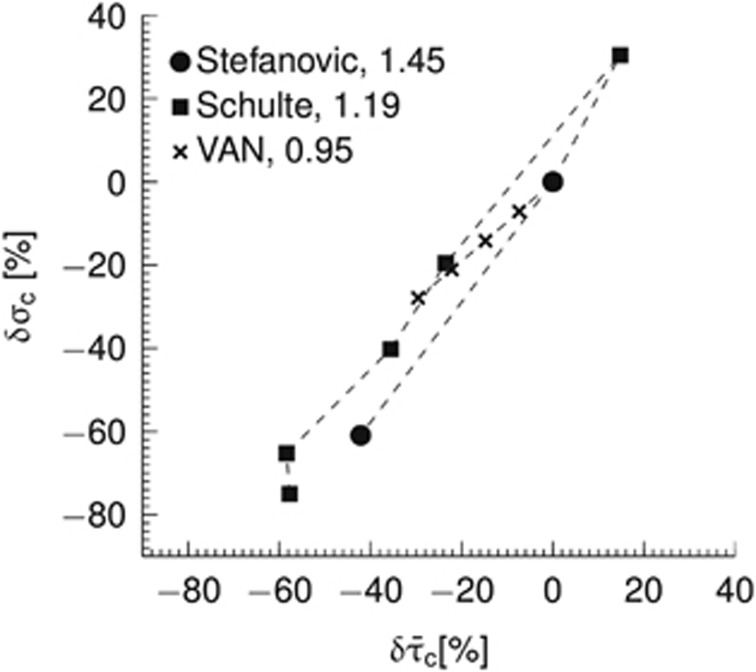
Figure 1.
Relationship between relative changes δ in average capillary transit time  and capillary transit time heterogeneity (CTH) as quantified by the standard deviation of the capillary transit time distribution σc. Pairs of
  from studies performed in rat by Stefanovic et al17 and Schulte et al,18 and simulation results from a vascular anatomic network (VAN) model.26 A decrease in σc with decreasing
  is observed both in the estimates based on experimental data and in the simulation data. Note that the individual data sets have been normalized with respect to baseline value, that is, the baseline of all data sets is in (0%, 0%). Numbers next to references in the caption refer to a coupling parameter θσ of a linear model relating
  and σc by
  . See Supplementary Material for details on the simulation and Jespersen and Østergaard24 for details on estimates based on experimental data.

