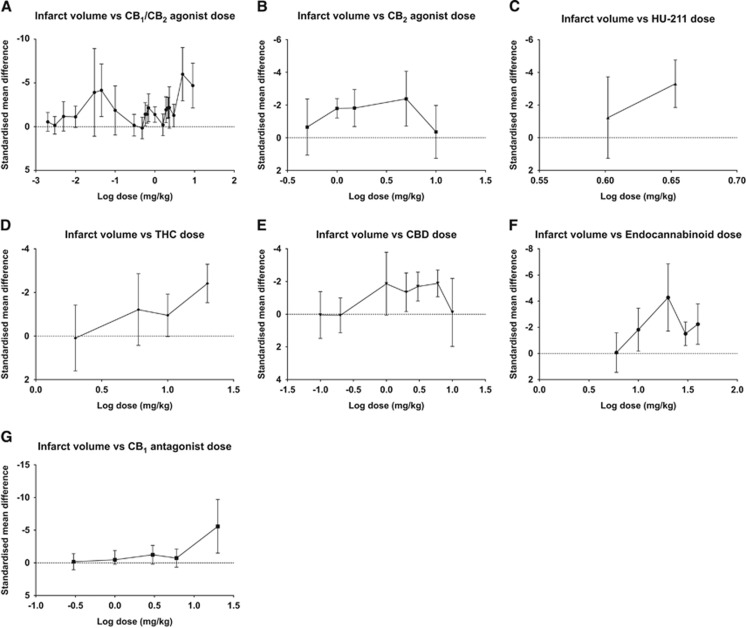
Figure 3.
The effect of cannabinoid (CB) drug dose on experimental infarct volume subdivided by drug class. The standardized mean difference (SMD) in infarct volume is plotted against log [dose] for each drug subgroup (A–G). Error bars represent 95% confidence intervals (CI) and values are not significant where they cross zero. CBD, cannabidiol; THC, Δ9-Tetrahydrocannabinol.

