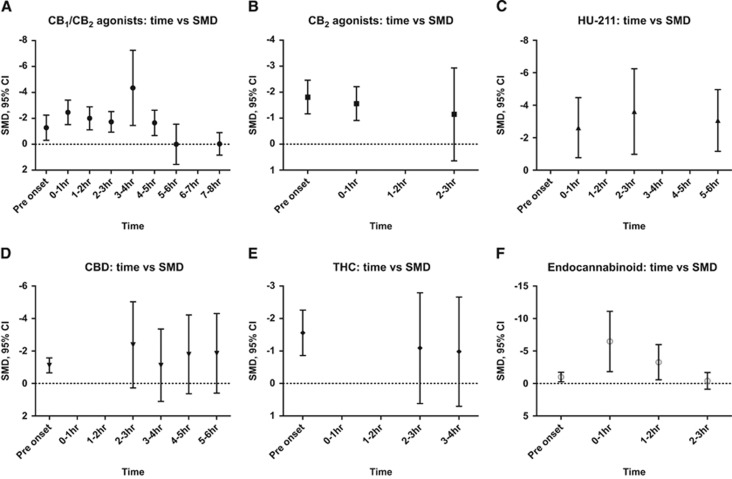
Figure 4.
The effect of time of administration on experimental infarct volume subdivided by drug class. The standardized mean difference (SMD) in infarct volume is plotted against time of administration for each drug subgroup (A–F). Error bars represent 95% confidence intervals (CIs) and values are not significant where they cross zero. CB, cannabinoid.

