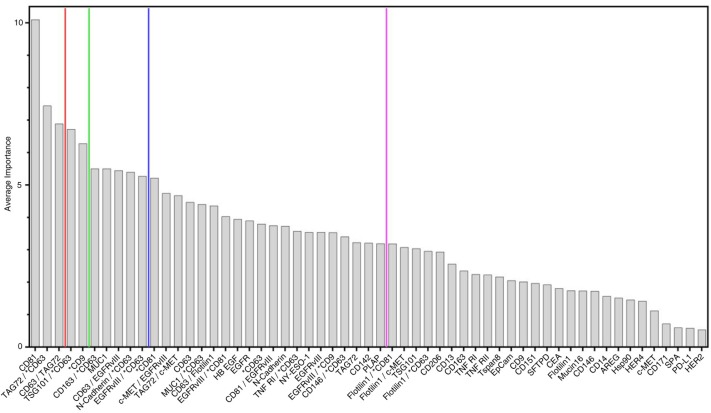
Fig. 5.
Multivariate analysis by Random Forests using the EV Array measurements of the exosomal antigens. The mean average importance to the classification model using the 30-marker panel illustrated in Fig. 4 for each of the analysed exosomal antigens, the normalised values (indicated by “*”) and their internal relations (indicated by “/”). The top 10 ranking did not change between the models including 3-, 5-, 10- or 30-markers and the markers included in each model are visualised by the coloured lines. Colours refer to the number of variables showed in Fig. 4.

