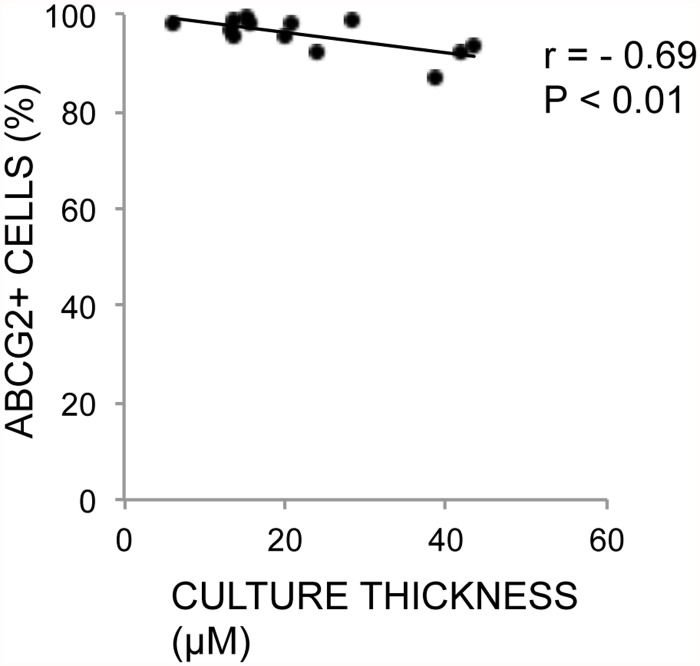
Fig 10. Correlation Between ABCG2 Expression and Thickness of Non-Stored Cultures.
Scatterplot with trend line of average thickness per culture (x-axis) against percentage of ABCG2-positive cells per culture (y-axis) for 13 non-stored human limbal epithelial cultures. r = Pearson’s correlation coefficient. P = p-value for Pearson’s correlation test.

