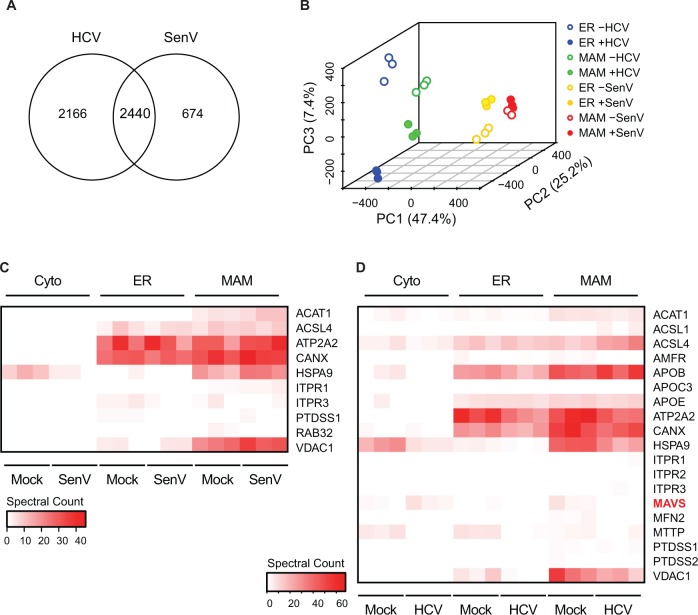
Fig 2. Proteomic analysis of subcellular fractions during RNA virus replication.
(A) Venn diagram of total numbers of proteins identified in mock or virus samples in all biochemical fractions from Huh7 cells (mock or replicating HCV RNA) and from PH5CH8 cells (mock or after 8h of SenV infection). (B) Principal component analysis of mock and virus samples for both HCV and SenV from ER and MAM fractions. Each colored dot (open circle: no virus; closed circle; with virus) represents a technical replicate sample for each condition. The graph shows the first three independent principal components (PC1, PC2, and PC3), along with the percentage of variance captured within each component in parentheses. (C, D) Heat map of expression of proteins identified within subcellular fractions (Cytoplasm (Cyto), ER, and MAM) in SenV (C) or HCV (D) and mock samples, cross-referenced to a list of proteins known to have MAM localization (see S2 Table). The intensity of the red color indicates the normalized spectral counts of each protein across technical triplicates, as shown in the key. In (D) MAVS is highlighted in red to indicate the importance of its localization profile in HCV biology.

