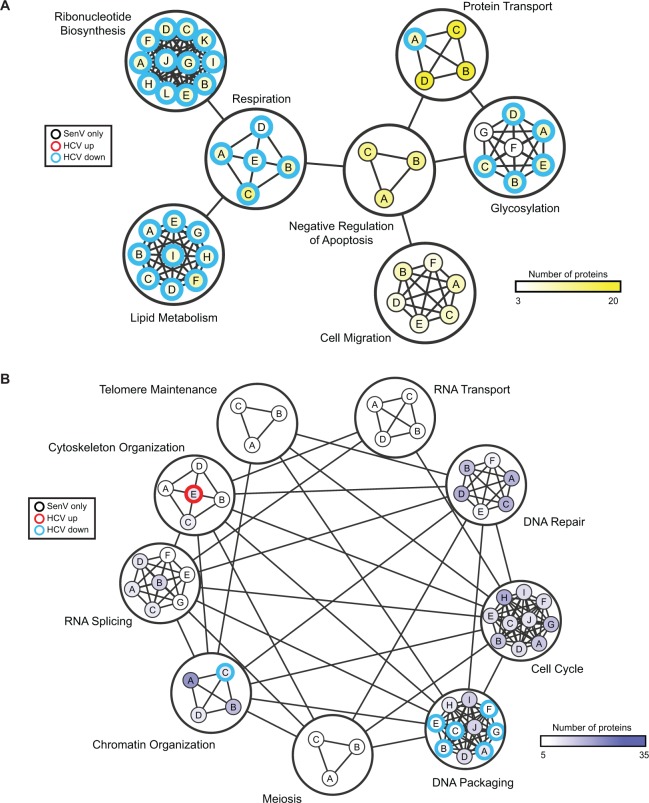
Fig 4. Network enrichment map of protein dynamics on the MAM during RNA virus replication.
Enrichment map for proteins moving into the MAM with SenV (A) or leaving the MAM with SenV (B), compared to the proteins identified on the MAM during HCV. Nodes represent enriched biological pathways grouped by DAVID-identified clusters, manually circled and classified by function, for proteins differentially expressed in the MAM fraction following SenV (≥2-fold; BH-adjusted p-value < 0.05). Nodes were classified by Functional Annotation Clustering of Gene Ontology (GO) biological pathways using the DAVID bioinformatics resource. Edges between nodes represent overlap between two pathways, and edges between functional category clusters represent at least one shared protein. Node internal color is proportional to the number of proteins comprising the canonical pathway (darker shading in the node means greater number of proteins). Node edges in red represent pathways enriched in the MAM in cells replicating HCV and SenV, and node edges in blue represent pathways enriched in groups of proteins leaving the MAM in cells replicating HCV and SenV. Nodes edges in black represent SenV-specific changes. Node identity is depicted by the letter within each node, and the key is listed in S4 Table.

