
Fig. 6.
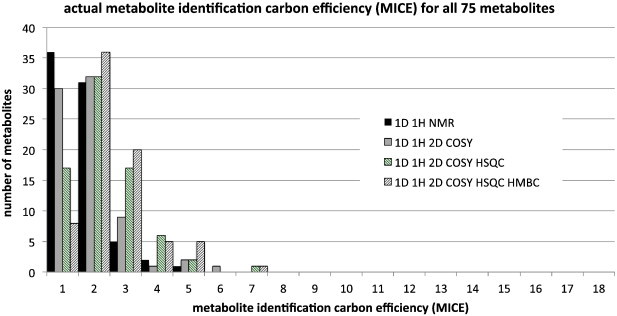
The actual experimental metabolite identification carbon efficiency (MICE) for all 75 metabolites and for four separate metabolic profiling approaches: 1D 1H NMR alone, 1D 1H plus COSY, 1D 1H plus COSY and HSQC data and 1D 1H plus COSY, HSQC and HMBC data. The histogram shows the number of metabolites for each approach with MICE values in bins of 0 to 1, > 1 to 2, > 2 to 3 etc. up to > 17 to18.