
Fig. 3.
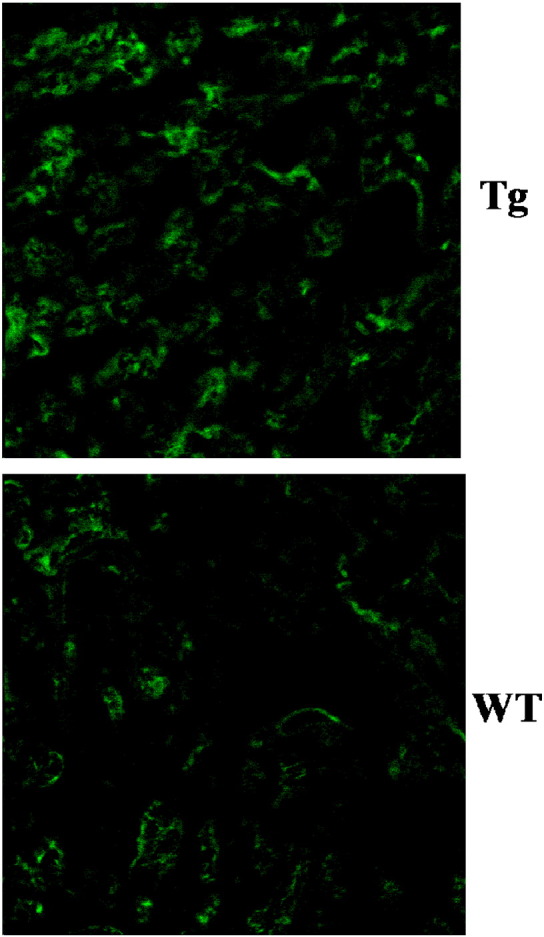
Increased cardiac protein S-nitrosylation levels in P2X4R Tg animals.
A typical example of S-nitrosylated proteins in P2X4R-overexpressing Tg and WT hearts (n = 5 for each) is shown as determined using biotin switch method. The counts of total summed intensities produced one distribution for each heart and analyzed with Kolmogorov–Smirnov test for equality of distributions. The test is rejected (P < 0.001) in favor of the distributions not being the same.
The figure and its legend are reproduced with permission from Wolters Kluwer Health (see Acknowledgment).