
Fig. 4.
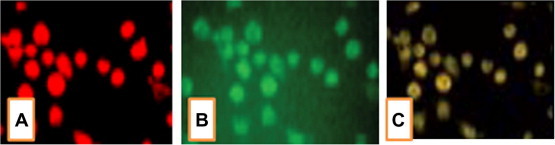
This figure represents picture for specific DiLDL-UEA-1 double staining of EPCs in culture for characterization. (A) DiLDL staining (200× magnification) and (B) UEA-1 staining (200× magnification). (C) merged picture for DiLDL-UEA-1 double staining of EPCs (200× magnification).