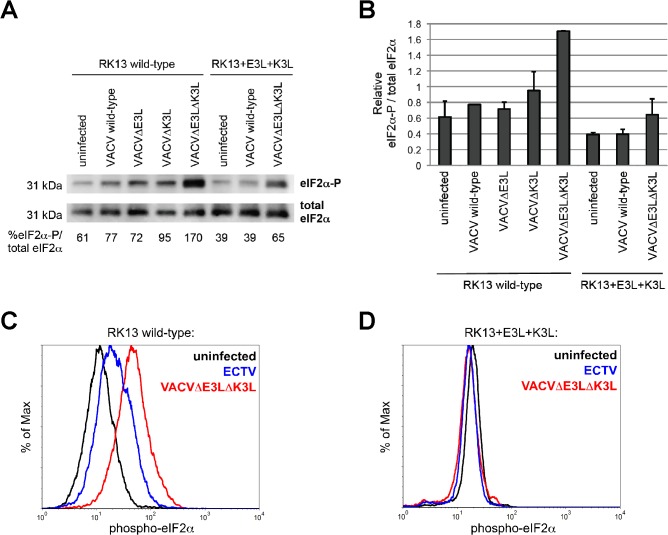
Fig 3. ECTV- and VACV-induced phosphorylation of eIF2α in RK13 cells.
(A) Wild-type RK13 or RK13+E3L+K3L cells were mock infected or infected with the indicated VACV strains at an MOI of 5. Cell lysates were collected 6 hours post infection and subjected to SDS-PAGE and immunoblot analysis. Membranes were first probed with antibodies against eIF2α phosphorylated at Ser51 (eIF2α-P; top row), stripped, and then re-probed with anti-eIF2α antibodies (total eIF2α; bottom row). Band intensities were measured using the Kodak Image Station 4000MM and the ratios of phosphorylated eIF2α to total eIF2α were calculated as a percentage and listed below the panels. (B) The average ratios of two independent western blots are indicated in the bar graph with error bars indicating the standard deviation. (C and D) Wild-type RK13 (C) or RK13+E3L+K3L cells (D) were mock infected or infected with the indicated viruses at an MOI of 5 for 12 hours at which time cells were collected, permeabilized, and stained for phosphorylated eIF2α. The histograms depict relative fluorescence intensity among total cells and are representative of three independent trials.

