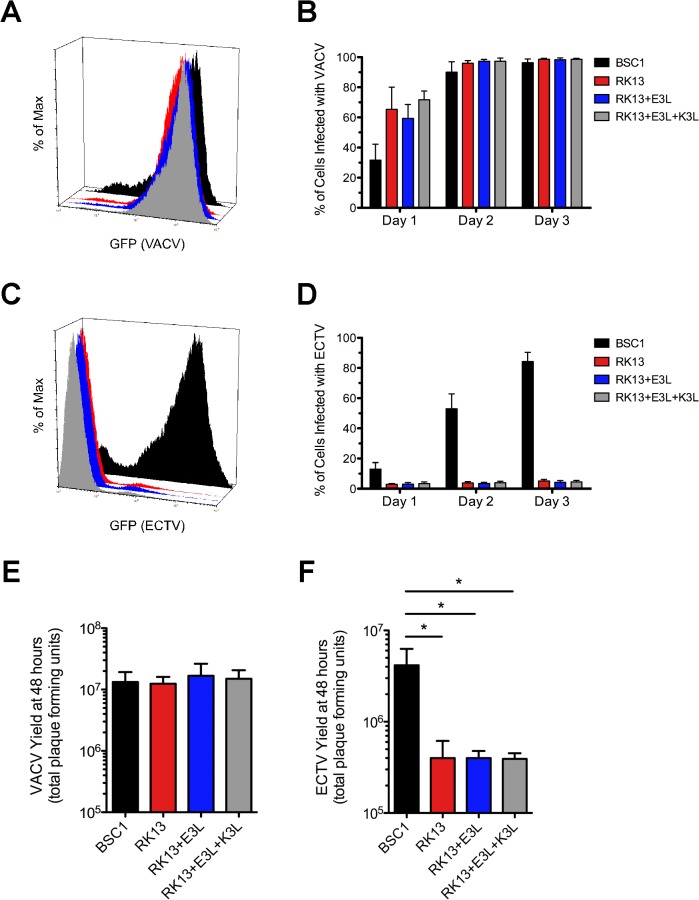
Fig 4. The replication of ECTV is reduced in RK13 compared to BSC1 cells even when VACV E3L and K3L are present during infection.
BSC1 (black bars), RK13 (red bars), RK13-E3L (blue bars), and RK13-E3L+K3L (gray bars) cells were initially infected with a low amount of VACV-GFP (MOI = 0.01) (A and B) or ECTV-GFP (MOI = 0.01) (C and D). Spread of virus in the culture well was quantified using flow cytometry. The histograms (A and C) depict relative fluorescence intensity among total cells at day 3 post-infection. The bar graphs (B and D) quantify levels of GFP on days 1, 2, and 3 post-infection in each cell type. The bars depict the average values and the error bars represent the standard deviations of three independent trials. The yield of w.t. VACV (E) and ECTV (F) was determined 48 hours after initial infection with a high amount of virus (MOI = 5) on cell monolayers. For quantification using a standard plaque assay, harvested virus was added to monolayers of BSC1 cells after serial dilution. The bars depict the average values and the error bars represent the standard deviations of three independent trials. Statistical analysis [performed using GraphPad Prism software (version 5.0a)] was carried out using a one-way ANOVA (nonparametric; Kruskal-Wallis) followed by a Dunns test for multiple comparisons. * denotes a p value <0.05.

